
H1: 2026-10-21
H-LOG 2026.10.21 [EN]
📈 [2026-10-21 close]
H-LOG: the cash session (Spot) summary
This is the summary of the cash session (Spot) from 2026-10-21. The NDX index closed at 29819.60, representing an increase of 1.13%, with CVD at −155,07 M and ADR consumption of 89.12%. The NQ futures contract recorded a close at 30029.75 (change +1.18%) with CVD of 6,71 K and ADR at 70.98%. The QQQ ETF ended the session at 725.21, representing a change of 1.06%, with CVD of −129,25 K and ADR at 89.08%. The TICKQ indicator closed at 191.00 with SMA200 at -55.48, while the MOC Anomaly was -22,67 M.
H-Log report: session summary 2026-10-21
📈 [2026-10-21 21:07]
H-LOG: Professionals Report
the cash session (Spot)
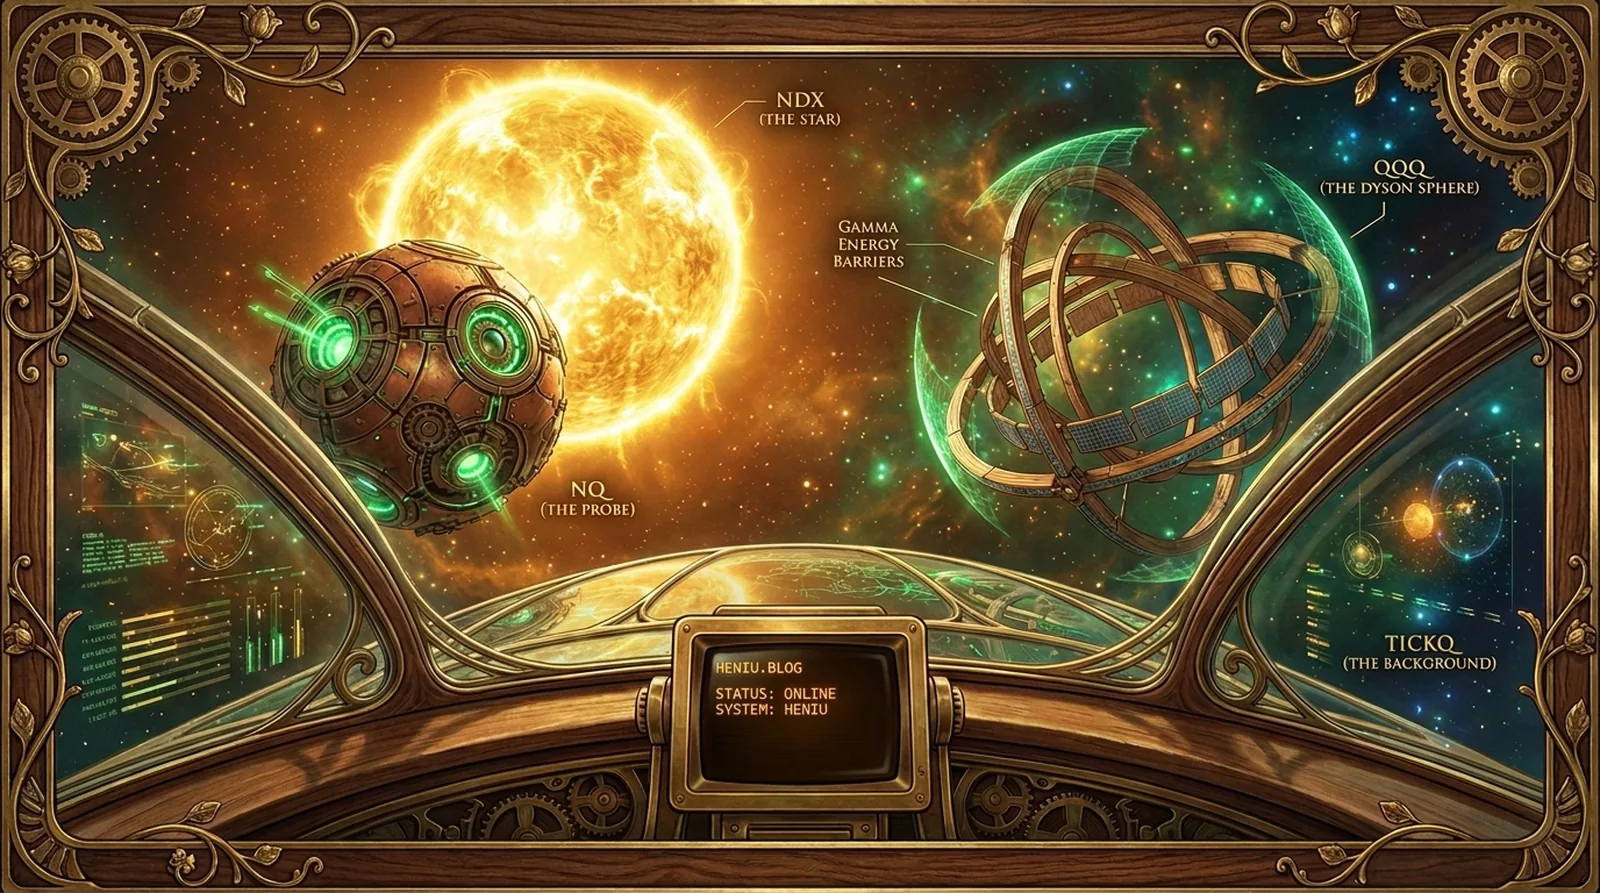
Market situation and flows: The NDX Star is rising by 0.96% (29771.45), however, the cumulative energy flow (CVD) shows selling pressure at -15.06M, suggesting testing of supply at current levels. In contrast to the NDX Star, NQ Probe (+0.95%) and the Dyson Sphere (QQQ) (+0.92%) show testing of demand (CVD at 4.17K and 275.16K respectively). The aggregate flow direction indicator is -7, which means a slight advantage of capital distribution in general terms. The broad market (TICKQ) is at 416.00, significantly above the SMA200 average of -63.59.
QQQ options analysis: Implied Volatility (IV) is 21.19%, with options volume at 5,783,789. The Put/Call Ratio is 1.01, indicating almost balanced sentiment with a slight advantage of put options, suggesting the building of hedges. The market-expected price range for the Dyson Sphere (QQQ) is between 720.08 – 732.78.
Correction context and technical levels: The ongoing Drawdown from Heniu's peak from 06.10 (31360.85) is -5.07% (-1589 pts). Based on historical data, this is a larger-scale correction (exceeding the median and 80th percentile of previous movements). The nearest resistance is located in the volume node zone 29940–29960 (1.6% volume), while the nearest support is the zone 29640–29660 (1.7% volume).
H-Log Report: 2026-10-21 21:07
📈 [2026-10-21 20:07]
H-LOG: Professionals Report
the cash session (Spot)
- Flow and price analysis: The NDX index is rising by 1.27% to the level of 29865.26, with cumulative CVD energy flow at 811.38K [demand test]. NQ contracts (30050.25, +1.26%) and the QQQ Dyson Sphere (726.43, +1.23%) show accumulation, confirming a positive direction of movement in the cash sector. The flow direction indicator is -2, indicating a neutral structure with a slight predominance of capital distribution. The broad market (TICKQ) Background Radiation is at 92.00, which, given an SMA200 average of -68.25, testifies to the strong relative strength of buyers.
- Options market: Implied volatility (IV) is 21.13%, and the Put/Call ratio (PCR) is shaped at 0.98 with a total volume of 5,185,576. These data indicate a near equilibrium between hedges and long positions, with the market expecting the QQQ instrument movement range between 721.18 and 733.76.
- Correction context and technical levels: The current Drawdown from Heniu's peak on 06.10 (31360.85) is -4.77% (-1496 pts). This is a movement of a larger correction character, deeper than 57% of historical cases in the analyzed dataset. The nearest resistance is located in the volume node zone 29940–29960 (0.25% above the current price), while support is located in the 29640–29660 zone (1.7% volume).
H-Log Report: 2026-10-21 20:07
📈 [2026-10-21 19:07]
H-LOG: Professionals Report
the cash session (Spot)
- Flow and price analysis: The NDX index is rising by 1.39% to the level of 29900.66, with cumulative energy flow (CVD) at 7.39 M [demand test]. An upward directional convergence was noted on NQ contracts (30087.00; +1.39%; CVD: 26.29 K [accumulation]) and QQQ ETF (727.32; +1.35%; CVD: 1.22 M [accumulation]). The flow direction indicator is -2, indicating a nearly neutral sentiment with a slight distribution edge. The broad market (TICKQ) is at the level of 246.00, which, with a SMA200 average of -71.97, confirms strong relative strength of growth components.
- QQQ options market: With a volume of 4 204 619, implied volatility (IV) is 21.09%. The Put/Call Volume Ratio at 0.98 suggests an approach to equilibrium between hedging demand and upward speculation. The expected movement range oscillates between 719.87 and 732.57.
- Correction context and technical levels: The ongoing drawdown from the peak of 06.10 (31360.85) is -4.66% (-1460 pts). This is a larger-scale correction (above the median of historical moves), deeper than 57% of previous corrections in the analyzed period.
- Key levels: The nearest resistance is located in the volume node zone 29940–29960 (1.6% volume), which the price is currently very close to (0.13% distance). Close support was identified in the 29640–29660 zone (1.7% volume).
H-Log Report: 2026-10-21 19:07
📈 [2026-10-21 18:07]
H-LOG: Professionals Report
the cash session (Spot)
- Market situation and flows: The market is recording increases (NDX +1.18%, NQ +1.17%, QQQ +1.13%), while simultaneously showing a negative flow direction indicator (-2), which indicates a slight advantage of capital distribution despite rising prices. In the cash market, a demand test was recorded (CVD NDX: 8,14 M, CVD QQQ: 968,78 K) and accumulation on NQ contracts (CVD: 23,81 K). The TICKQ indicator is -80.00, which, with the SMA200 average at -79.44, suggests strong selling pressure in the broader market.
- QQQ options analysis: Implied volatility (IV) is 21.20%, and the Put/Call ratio (PCR) stands at 0.94 with a total volume of 3,412,190. These data indicate a near equilibrium between hedges and long positions, with a slight tilt towards neutral. The market-expected range of movement lies between 717.07 and 730.27.
- Correction context and technical levels: The ongoing drawdown from the peak of 06.10 (31360.85) is -4.85% (-1521 pts), which classifies this move as a major correction (above the median of historical declines). The nearest resistance is located in the 29940–29960 zone (1.6% volume), while support is in the 29640–29660 zone (1.7% volume).
H-Log Report: 2026-10-21 18:07
📈 [2026-10-21 17:07]
H-LOG: Professionals Report
the cash session (Spot)
- Flow and price analysis: The NDX Star is currently at 29758.80 (+0.91%). A significant anomaly in flows was noted: despite the price increase, the cumulative energy flow (CVD) for NDX is 1.31 M, indicating a test of demand on the cash market. NQ Probe contracts (29946.50, +0.91%) show accumulation with CVD at 12.68 K, and the Dyson Sphere (QQQ) ETF (723.90, +0.87%) confirms the demand test (CVD 627.02 K). The flow direction indicator is 0, meaning there is no clear advantage between capital inflow and outflow.
- Broad market and sentiment: The TICKQ Background Radiation is 9.00, which, with a SMA200 average at -83.57, indicates a reversal of sentiment in the broad Nasdaq market towards neutral/positive.
- Options market: Implied Volatility (IV) is 21.73%, with an options volume of 2,070,470. The Put/Call Volume Ratio at 0.95 suggests a close balance between demand for hedges and long positions. The market-expected movement range for QQQ lies between 715.61 and 729.83.
- Technical context and levels: A correction is ongoing from the peak of 06.10 (31360.85), which currently stands at -5.11% (-1602 pts). This is a larger-scale correction (above the median of historical corrections).
H-Log Report: 2026-10-21 17:07
📈 [2026-10-21 16:07]
H-LOG: Professionals Report
the cash session (Spot)
- Market situation and flows: The NDX index is up 0.60% (29672.14), however, a supply test was recorded at a CVD level of −7,19 M. In contrast to the index, NQ contracts (+0.59%) and the QQQ ETF (+0.55%) show a demand test (CVD at 3,96 K and 235,52 K respectively). The flow direction indicator is 5, which indicates a nearly neutral, slightly positive market sentiment. The broad market (TICKQ) is in a zone of strong selling pressure at a value of -220.00, which deviates significantly from the SMA200 average of -80.75.
- QQQ options analysis: Implied volatility (IV) is 21.86%, with option volume at 519,165. The Put/Call Volume Ratio is 1.26, suggesting a predominance of hedging positions or anticipation of greater selling pressure. The expected range of movement for QQQ is between 714.53 and 729.71.
- Correction context and technical levels: The ongoing drawdown from the peak on 06.10 (31360.85) is currently -5.38% (-1689 pts), which classifies it as a larger correction relative to the historical median.
H-Log Report: 2026-10-21 16:07
📈 [2026-10-21 15:07]
H-LOG: Professionals Report
the futures session
- the cash session (Spot) is currently closed. Analysis is based on active trading of NQ futures contracts, which show an increase of +0.69% at a price of 29879.00 and cumulative energy flow (CVD) at a level of 6,22 K, indicating testing of demand in the after-hours session.
- The flow direction indicator is 15, which means a weak advantage of capital inflow. Nevertheless, at the close of the cash session, a significant anomaly was recorded: with a decrease in the NDX Star index of -0.13% (price 29493.60), the cumulative energy flow (CVD) was 125,53 M, suggesting passive absorption of supply by buyers.
- The current Drawdown from Heniu's peak from 06.10 (31360.85) is -5.95% (-1867 pts). This is a correction larger than 57% of historical deviations in the analyzed period.
- Key technical levels: the nearest support zone is in the 29470–29490 range (1.3% volume), while resistance is located in the 29520–29540 zone (2.5% volume).
- QQQ Dyson Sphere data (volume 896, PCR 0.89) indicate a moderate advantage of long (call) positions over short (put) positions. The market-expected range of movement within options is between 708.81 and 726.45.
H-Log Report: 2026-10-21 15:07
📈 [2026-10-21 14:07]
H-LOG: Professionals Report
the futures session
- The cash session (Spot) is currently closed. Active trading is taking place on NQ contracts, priced at 29859.00 (+0.62%), with a cumulative CVD energy flow at 4.65 K, indicating demand testing.
- Taking into account the data from the close of the cash session, the NDX Star recorded a decrease of -0.13% to the level of 29493.60, with a simultaneous CVD energy flow of 125.53 M. The flow direction indicator is 25, meaning a slight advantage in capital inflow.
- QQQ Dyson Sphere analysis indicates increased activity in the hedging sector (Put/Call Ratio = 1.20) with a volume of 8,656,390. Implied volatility (IV) is 22.14%, and the expected range of movement for the QQQ instrument is between 708.81 and 726.45.
- The current NDX Drawdown from Heniu's peak on 06.10 (31360.85) is -5.95% (-1867 pts). This is a movement of a larger correction character, deeper than 57% of historical cases in the analyzed period.
H-Log Report: 2026-10-21 14:07
📈 [2026-10-21 13:07]
H-LOG: Professionals Report
the futures session
- The cash session (Spot) is currently closed. The main trading instrument is NQ contracts, which are trading at 29842.50 (+0.56%), showing a demand test with cumulative energy flow (CVD) at 2.38 K.
- Analysis of the cash session close data indicates a significant anomaly: despite a 0.13% drop in the NDX index (price 29493.60), the cumulative energy flow (CVD) for NDX was 125.53 M, suggesting strong buying pressure in the cash session. The market flow direction indicator is 25, signifying a moderate advantage in capital inflow.
- The QQQ options market at a volume of 8,656,390 indicates a dominance of short positions (Put/Call Ratio = 1.20), suggesting market participants are building hedges. Implied volatility (IV) is 22.14%, and the expected price range for QQQ is within the 708.81 – 726.45 interval.
- The current NDX Drawdown from Heniu's peak on 06.10 (31360.85) is -5.95% (-1867 pts). This is a correction larger than the median of historical movements, deeper than 57% of recorded corrections in the system memory.
- Key technical levels: the nearest support zone (volume node) is in the 29470–29490 range (1.3% volume). The nearest resistance zone is above the price in the 29520–29540 range (2.5% volume).
H-Log Report: 2026-10-21 13:07
📈 [2026-10-21 12:07]
H-LOG: Professionals Report
the futures session
- The cash session (Spot) is currently closed. Analysis is based on NQ futures contracts, which are trading at 29773.75 (+0.33%), while simultaneously noting a supply test (CVD NQ = -221).
- The flow direction indicator is 5, which indicates a neutral capital inflow advantage on a global scale.
- In the context of the cash session (closed), the NDX index showed anomalous activity: despite a price decrease of -0.13% (29493.60), the cumulative energy flow (CVD) was 125.53 M, suggesting passive absorption of supply at the close.
- The QQQ options market (volume 8,656,390) shows a Put/Call Ratio of 1.20, which, with an implied volatility (IV) of 22.14%, indicates the building of hedging positions and a demand advantage for put options. The expected range of movement for QQQ is between 708.81 and 726.45.
- The ongoing NDX Drawdown from Heniu's peak on 06.10 (31360.85) is -5.95% (-1867 pts). This is a movement of a larger correction character, deeper than 57% of historical deviations in the analyzed period.
H-Log Report: 2026-10-21 12:07
📈 [2026-10-21 11:07]
H-LOG: Professionals Report
the futures session
- the cash session (Spot) is currently closed. Analysis is based on NQ futures contracts, which are trading at 29762.00 (+0.29%), while simultaneously testing supply (CVD: −1,17 K).
- The flow direction indicator is 5, indicating a neutral trend with a slight advantage in capital inflow.
- On the QQQ options market, a volume of 8,656,390 was recorded with a Put/Call Ratio at 1.20. This indicates increased activity in the hedging area or anticipation of higher volatility, which is confirmed by the implied volatility (IV) at 22.14% and the expected movement range between 708.81 and 726.45.
- The current Drawdown from Heniu's peak from 06.10 (31360.85) for the NDX index is -5.95% (-1867 pts). This is a correction greater than the median of historical movements, deeper than 57% of all recorded corrections.
- Key technical levels: the nearest support zone is in the 29470–29490 range (1.3% volume), while resistance is located in the 29520–29540 zone (2.5% volume).
H-Log Report: 2026-10-21 11:07
📈 [2026-10-21 10:07]
H-LOG: Professionals Report
the futures session
- Futures and cash market: The cash session (Spot) is currently closed. NQ contracts are trading at 29881.75 (+0.70%), indicating a demand test in the evening session. The NDX index closed the cash session at 29493.60 (-0.13%). Despite the decline in the index price, the cumulative energy flow (CVD) for NDX was 125,53 M, which, given the current dynamics, indicates the presence of capital inflow.
- Sentiment and flows: The aggregate flow direction indicator is 25, signaling a moderate dominance of capital inflow into the market.
- QQQ options analysis: Implied volatility (IV) is 22.14%. Put/Call Volume Ratio at 1.20 suggests a dominance of Put positions, which may indicate investors building hedges. The expected range of movement for QQQ is between 708.81 and 726.45 with an option volume of 8,656,390.
- Technical levels: A larger correction is underway from the peak on 06.10 (31360.85), which amounted to -5.95% (-1867 pts).
H-Log Report: 2026-10-21 10:07
📈 [2026-10-21 09:07]
H-LOG: Professionals Report
the futures session
- The cash session (Spot) is currently closed; analysis is based on NQ futures contracts and data from the regular session close. NQ contracts are trading at 29830.25 (+0.52%) with a cumulative energy flow (CVD) of 704, indicating demand testing.
- The NDX Star closed the cash session at 29493.60 (-0.13%). A significant divergence was noted: despite the price drop, the cumulative energy flow (CVD) for the NDX Star was 125.53 M, which, given the current dynamics, indicates buying activity in the cash session.
- The flow direction indicator is 25, meaning a moderate advantage in capital inflow. In the Dyson Sphere (QQQ) options market (volume 8,656,390), a dominance of short positions is visible (Put/Call Ratio = 1.20), suggesting hedging activity with implied volatility (IV) at 22.14%. The market-expected price range is between 708.81 and 726.45.
- The current Drawdown from Heniu's peak on 06.10 (31360.85) is -5.95% (-1867 pts). This is a deeper move than 57% of historical corrections recorded in the system's memory, classifying the current situation as a major correction.
H-Log Report: 2026-10-21 09:07
📈 [2026-10-21 08:07]
H-LOG: Professionals Report
the futures session
- The cash session (Spot) is currently closed. Main trading is occurring on NQ contracts, priced at 29856.50 (+0.60%), with cumulative energy flow (CVD) at 840, indicating demand testing.
- The NDX Star closed the cash session at 29493.60 (-0.13%). Despite the price drop, a cumulative energy flow (CVD) of 125,53 M was recorded, which, given current market dynamics, indicates strong buying pressure in the cash sector.
- The market flow direction indicator is 25, signaling a moderate advantage of capital inflow into the system.
- QQQ Dyson Sphere analysis indicates a dominance of short positions (Put/Call Ratio = 1.20) with a volume of 8,656,390, suggesting investors are building hedges. Implied Volatility (IV) is 22.14%, and the expected range of movement is between 708.81 and 726.45.
- Technical context: A correction from the peak on 06.10 (31360.85) is ongoing, which amounted to -5.95% (-1867 pts). This is a correction of a larger nature (above the median of historical declines).
H-Log Report: 2026-10-21 08:07
📈 [2026-10-21 07:07]
H-LOG: Professionals Report
the futures session
- The cash session (Spot) is currently closed. Active trading is occurring on NQ futures contracts, priced at 29878.00 (+0.69%), with cumulative energy flow (CVD) at 2.14 K, indicating demand testing.
- The market flow direction indicator is 25, signaling a moderate dominance of capital inflow across the entire market.
- A significant anomaly was noted at the close of the cash session: despite the NDX Star dropping by (-0.13%) to the level of 29493.60, cumulative energy flow (CVD) was 125.53 M, which at the current valuation indicates strong accumulation pressure and passive absorption of supply.
- QQQ Dyson Sphere analysis at a volume of 8,656,390 indicates a dominance of downside positions (Put/Call Ratio = 1.20), suggesting market participants are building hedges. Implied volatility (IV) is 22.14%, and the expected range of movement for QQQ lies within the 708.81 – 726.45 interval.
- The current Drawdown from Heniu's peak from 06.10 (31360.85) is -5.95%, classifying this move as a larger correction in comparison with historical data.
H-Log Report: 2026-10-21 07:07
📈 [2026-10-21 06:07]
H-LOG: Professionals Report
the futures session
- The cash session (Spot) is currently closed. Active trading is occurring on NQ contracts, priced at 29913.00 (+0.80%), with cumulative energy flow (CVD) at 3.05 K, indicating testing of demand.
- The NDX Star closed the cash session at 29493.60 (-0.13%). A significant anomaly was noted: despite the price drop, the cumulative energy flow (CVD) for the NDX Star was 125.53 M, suggesting strong accumulation pressure and passive absorption of supply in the cash session.
- The current Drawdown from Heniu's peak (31360.85) is -5.95% (-1867 pts), classifying it as a larger correction (above the median and 80. percentile of historical moves). The flow direction indicator is 25, signifying a moderate advantage in capital inflow.
- QQQ Dyson Sphere options data: Implied Volatility (IV) is 22.14%, and the Put/Call Ratio at 1.20 suggests the building of hedging positions or a dominance of bearish expectations. The market-expected movement range lies between 708.81 and 726.45.
H-Log Report: 2026-10-21 06:07
📈 [2026-10-21 05:07]
H-LOG: Professionals Report
the futures session
- The cash session (Spot) is currently closed. Active trading is occurring on NQ contracts, which are trading at 29974.50 (+1.01%), with cumulative CVD fuel flow at 4,96 K, indicating testing of demand in the pre-market session.
- Considering the regular session close, the NDX Star closed at 29493.60 (-0.13%). Despite the price drop, high flow activity was recorded in the cash session (CVD NDX = 125,53 M), which, given the current direction, indicates strong accumulation pressure (passive absorption of supply).
- The flow direction indicator is 25, confirming the overall dominance of capital inflow into the market.
- Analysis of the Dyson Sphere (QQQ) at a volume of 8,656,390 indicates a Put/Call Ratio of 1.20, suggesting the building of hedging positions or a dominance of bearish expectations in the short term. Implied Volatility (IV) is 22.14%, and the expected range of movement for QQQ is within the 708.81 – 726.45 range.
- The current Drawdown from Heniu's peak on 06.10 (31360.85) is -5.95%, which classifies the current move as a larger correction in historical terms.
H-Log Report: 2026-10-21 05:07
📈 [2026-10-21 04:07]
H-LOG: Professionals Report
the futures session
- the cash session (Spot) is currently closed. Active trading is occurring on NQ contracts, priced at 29982.00 (+1.03%), with cumulative CVD energy flow at 3,25 K, indicating demand testing in the after-hours session.
- The NDX Star closed the cash session at 29493.60 (-0.13%). A significant anomaly was noted: despite the price drop, the cumulative energy flow (CVD) for NDX was 125,53 M, suggesting active supply absorption or accumulation at lower levels.
- The aggregate flow direction indicator is 25, indicating a moderate advantage of capital inflow into the market.
- QQQ Dyson Sphere analysis at a volume of 8,656,390 indicates a dominance of short positions (Put/Call Ratio = 1.20), suggesting hedging against a potential further correction. Implied volatility (IV) is 22.14%, and the expected movement range for the QQQ instrument is within the 708.81 – 726.45 range.
- The current drawdown from Heniu's peak on 06.10 (31360.85) is -5.95% (-1867 pts). This is a deeper move than 57% of historical corrections in the analyzed period.
H-Log Report: 2026-10-21 04:07
📈 [2026-10-21 03:07]
H-LOG: Professionals Report
the futures session
- the cash session (Spot) is currently closed. Active trading is occurring on NQ futures, priced at 29854.75 (+0.60%), while simultaneously testing supply visible in the cumulative energy flow (CVD = -1,06 K).
- The market flow direction indicator is 5, indicating a nearly neutral sentiment with a slight advantage in capital inflow.
- On the QQQ options market, a volume of 8,656,390 was recorded with implied volatility (IV) at 22.14%. A Put/Call Ratio of 1.20 suggests increased activity in the hedging area or anticipation of greater selling pressure, with an expected move range between 708.81 and 726.45.
- The current Drawdown from Heniu's peak from 06.10 (31360.85) for the NDX index is -5.95% (-1867 pts). This is a larger-scale correction (above the median of historical moves).
H-Log Report: 2026-10-21 03:07
📈 [2026-10-21 02:07]
H-LOG: Professionals Report
the futures session
- The cash session (Spot) is currently closed. Analysis is based on active trading of NQ futures contracts, which are trading at 29882.50 (+0.70%), while simultaneously testing supply (CVD = -404).
- The NDX index closed the cash session at 29493.60 (-0.13%). A significant anomaly was noted: despite the price drop, the cumulative energy flow (CVD) for NDX is 125,53 M, indicating strong absorption of supply in the cash session.
- The aggregate flow direction indicator is 5, indicating an almost neutral, but slightly positive capital inflow advantage.
- The QQQ options market at a volume of 8,656,390 indicates a dominance of short positions (Put/Call Ratio = 1.20), suggesting investors are building hedges. Implied volatility (IV) is 22.14%, and the expected range of movement is between 708.81 and 726.45.
- The current drawdown from the peak (from 06.10: 31360.85) is -5.95% (-1867 pts). This is a movement of a larger correction character, deeper than 57% of historical deviations in the analyzed period.
H-Log Report: 2026-10-21 02:07
📈 [2026-10-21 01:07]
H-LOG: Professionals Report
the futures session
- the cash session (Spot) is currently closed; analysis is based on futures contracts and data from the regular session close. NQ contracts are trading at 29902.75 (+0.77%) with a cumulative CVD energy flow of 12, indicating testing of demand in the evening session.
- The NDX Star closed the cash session at 29486.67 (-0.13%). A significant divergence was noted: despite the price drop, the cumulative energy flow (CVD) for NDX was 125.53 M, suggesting buying activity during the declines. The current Drawdown from Heniu's peak from 06.10 (31360.85) is -5.98% (-1874 pts), classifying the current move as a larger correction (above the median of historical moves).
- The flow direction indicator is 25, meaning a moderate advantage of capital inflow into the market.
- In the QQQ Dyson Sphere area, implied volatility (IV) is 22.14%, and the Put/Call Volume Ratio at 1.20 indicates increased activity towards hedging or building short positions. The market-expected range of movement for QQQ is between 711.45 – 723.81.
- Key technical levels: the nearest support zone (volume node) is in the 29470–29490 range. Resistance is located above the price, in the 29520–29540 zone.
H-Log Report: 2026-10-21 01:07
📈 [2026-10-21 00:07]
H-LOG: Professionals Report
the futures session
- the cash session (Spot) is currently closed. Active trading is occurring on NQ contracts, priced at 29929.25 (+0.86%), with cumulative energy flow (CVD) at 493, indicating demand testing.
- the NDX Star (price 29486.67, -0.13%) is in a phase of a larger correction, which from the peak on 06.10 (31360.85) has amounted to -5.98% (-1874 pts). It is deeper than 57% of historical corrections recorded in the system memory. The nearest significant resistance (volume node) is located in the 29520–29540 zone.
- The aggregate flow direction indicator is 25, meaning a moderate advantage of capital inflow.
- The QQQ Dyson Sphere options market shows a Put/Call Volume Ratio of 1.20 with a volume of 8,656,390, suggesting a prevalence of hedging positions or a bearish sentiment. Implied volatility (IV) is 22.13%, and the market-expected price range for the QQQ ETF is between 711.45 and 723.81.
H-Log Report: 2026-10-21 00:07