
Log #0202: Gravity Decay and the Fuel Paradox
⚠️ ERRATUM (2026-10-17)
The Average Action in this entry was wrong. The prices of four companies above 1000 USD (ASML, MELI, MPWR, SNDK) were read incorrectly, so the average share price and its change were distorted.Corrections:
- Average Action: the correct values cannot be reconstructed, so we removed them.
- The 30270–30290 volume zone was above the closing price (29960.80), so it is resistance, not support.
- We removed the double percent sign at IV.
Stardate: 2026.10.14
Systems Status: External Observation
Sector: Inner Volatility Bands
Closing Telemetry#
Observation of an anomaly between the mass decline of instruments and the euphoria of energy flow in the Central Star. The system is in a phase of deep correction, despite the stability of the Core composition.
Subspace Scanner (Mass Distribution):
- System T-Mass: 42.67 Trillion USD
- Session Delta (24h): -0.85 Trillion USD
- Core Density (Heavy Nine): 68.74% (Delta: -0.02%)
- Average Action (Periphery Temperature): [NO DATA] (Delta: [NO DATA])
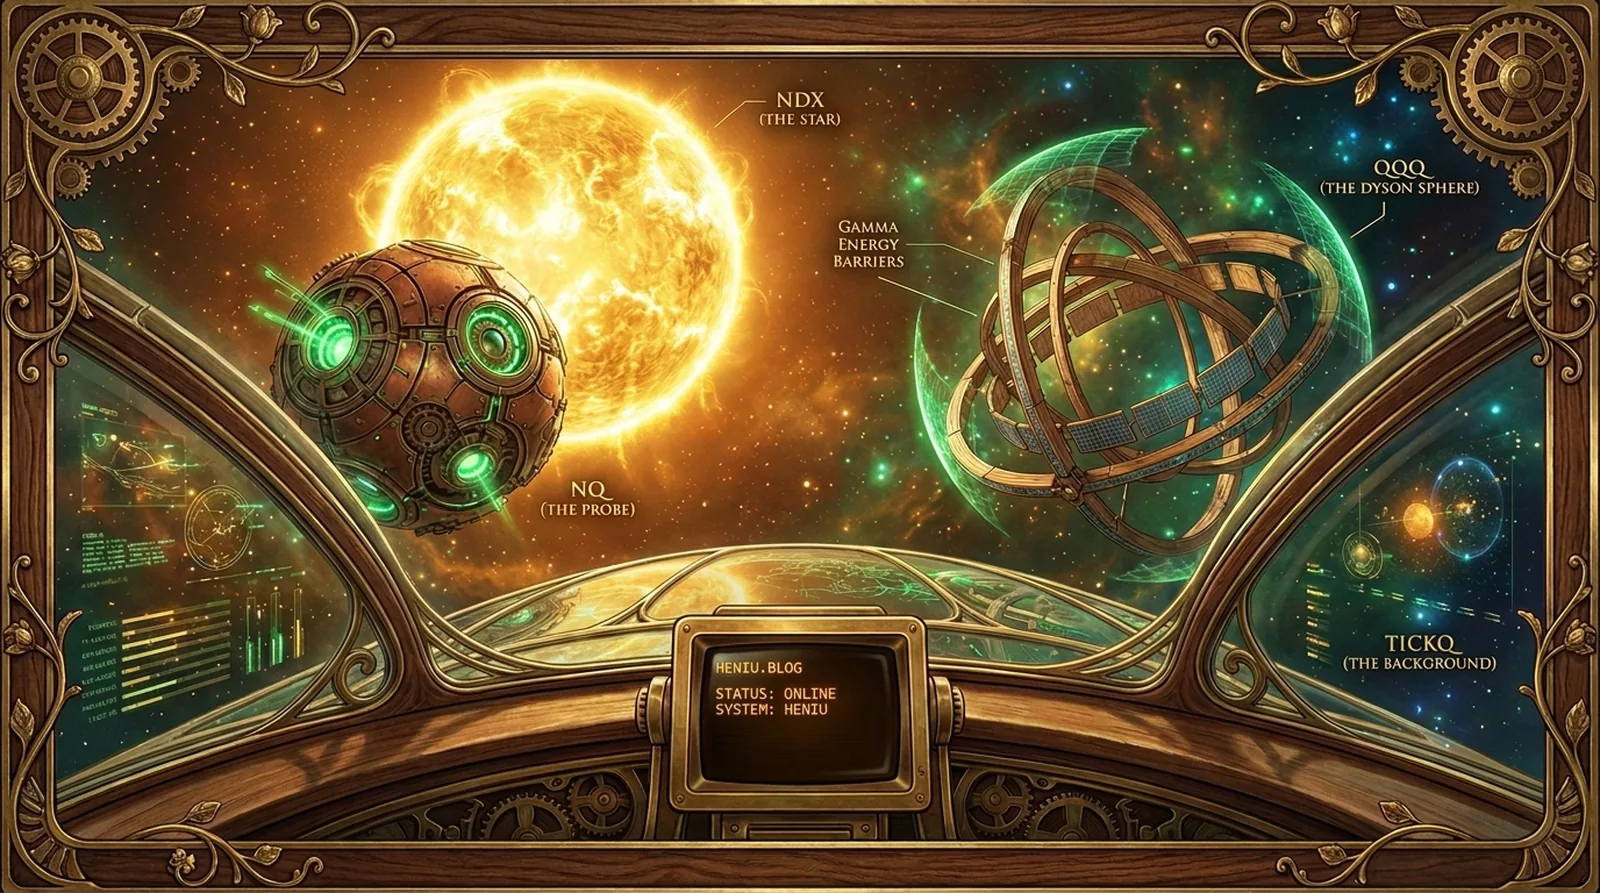
the NDX Star (Sun): Close: 29960.80 (-2.02%)
- Vector (CVD): 167,81 M [euphoria]
- MOC Anomaly: +33,82 M
- Range Consumption (ADR Util): 205.62%
- Drawdown from Heniu’s peak: -4.05% (highest close: 31226.82, 2026-10-06)
the NQ Probe (Mercury): Close: 30194.00 (-1.94%)
- Vector (CVD): 5,71 K [demand test]
- Range Consumption (ADR Util): 187.33%
the Dyson Sphere (QQQ): Close: 728.84 (-1.98%)
- Population Vector: 1,45 M [accumulation]
- Range Consumption (ADR Util): 203.45%
Background Radiation (TICKQ) -107.00 [sell-off]:
- SMA200: -75.59 [market breakdown]
Gravitational Structure (Options):
- Implied Volatility (IV): 20.35%
- Put/Call OI: 1.48
Logbook: Gravitational Decay and the Fuel Paradox#
1. Discrepancy in the NDX Singularity the Central Star (NDX) recorded a decline of 2.02% (29960.80), deepening the correction from the peak on 06.10 (31226.82) to a level of -4.05%. Despite the price decline, the CVD indicator shows a state of euphoria (167,81M), indicating a massive, price-inconsistent influx of fuel into the system. The Core composition (>1T) remains stable, with no detection of emergence or collapse of new singularities.
2. Force Field Degradation and Background Radiation the NQ Probe (30194.00) shows a demand test with CVD at the 5,71K level, while the Dyson Sphere (QQQ) (728.84) is in an accumulation phase (CVD 1,45M). Simultaneously, Background Radiation (TICKQ) indicates a sell-off (-107.00), and the SMA200 average radiation confirms a market breakdown (-75.59). The system records high volatility (IV: 20.35%) with a T-Mass of 42.67 Trillion USD.
3. Historical Correction Path Analysis The current NDX downward trajectory is deeper than 57% of the seven completed corrections recorded in the system memory. Volume nodes from the last 12 sessions indicate a resistance zone at 30270–30290 above the price, with the current price 1.03% below it. In the F-Pulse data, it was noted that net insiders over 5 sessions in Class 0 amounted to -796,49 K USD, while the overall system showed -62,74 M USD.
Quantum Verdict: The system is experiencing a rapid stratification: price is losing mass, while flow indicators (CVD) suggest unnatural euphoria in the center and accumulation in the outer sphere. The mechanics indicate a deep structural correction, not yet a complete collapse of the Core.
Status: EXTERNAL OBSERVATION. Shields active.
End of log.