
Log #0208: Dysonian Stabilization in the Shadow of a Singularity
Stardate: 2026.10.21
Systems Status: External Observation
Sector: Inner Volatility Bands
Closing Telemetry#
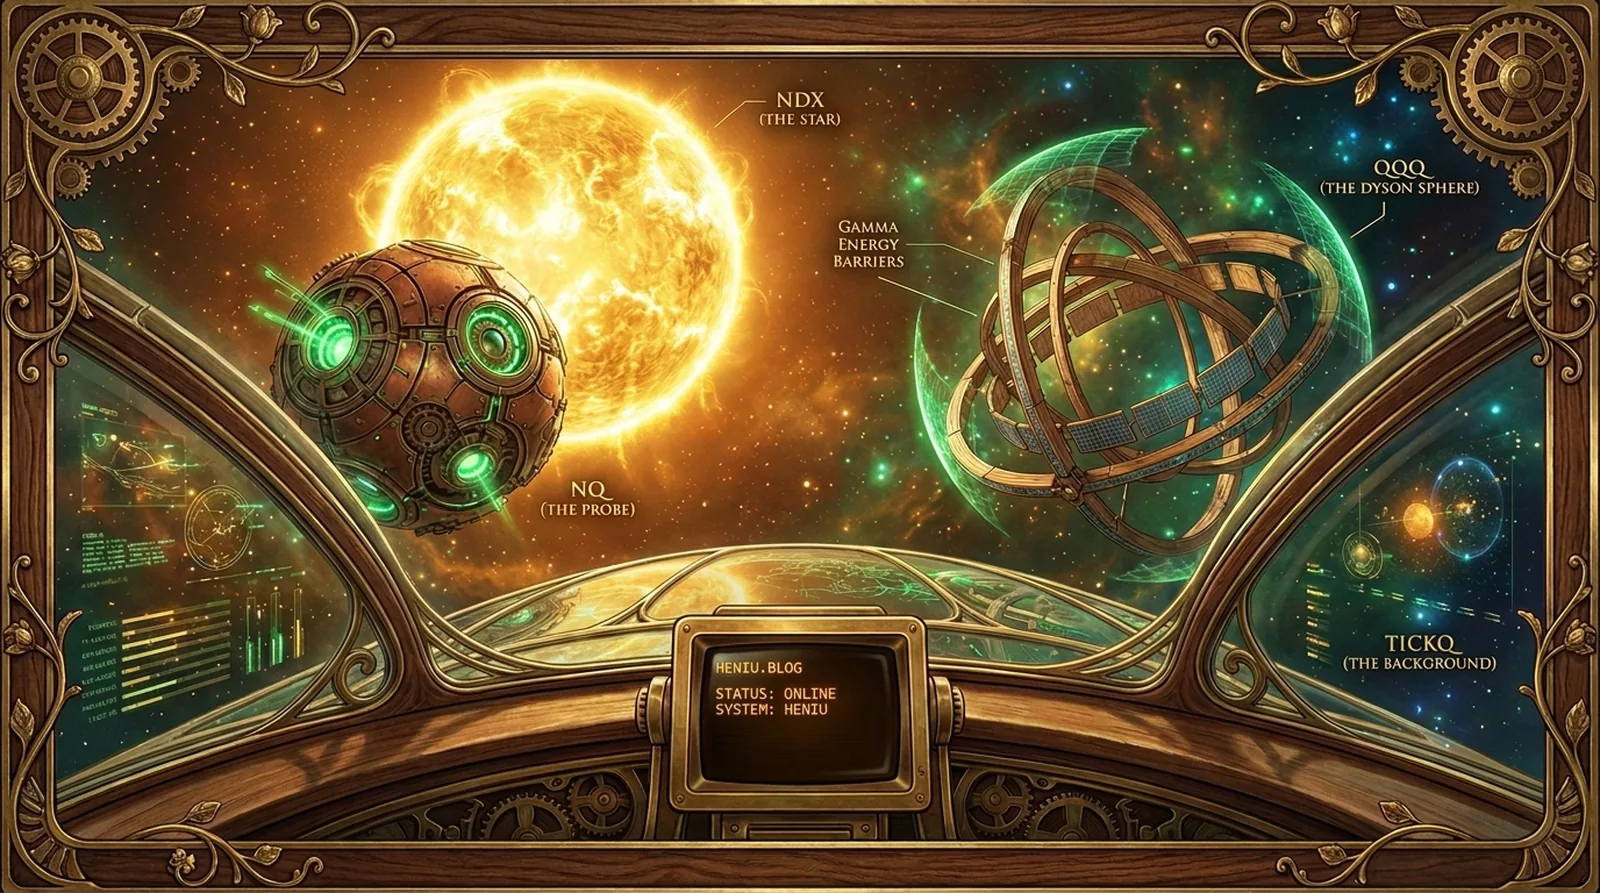
System observation shows a divergence between the energy of the NDX Star and the dynamics of the NQ Probe. Despite panic in the NDX fuel flow, the system shows signs of accumulation in the background radiation.
Subspace Scanner (Mass Distribution):
- System T-Mass: 42.57 Trillion USD
- Session Delta (24h): +0.51 Trillion USD
- Core Density (Heavy Nine): 68.88% (Delta: +0.09%)
- Average Action (Periphery Temperature): $307.65 (Delta: +$2.97)
the NDX Star (Sun): Close: 29819.60 (+1.13%)
- Vector (CVD): −155,07 M [panic]
- MOC Anomaly: -22,67 M
- Range Consumption (ADR Util): 89.12%
- Drawdown from Heniu’s peak: -4.51% (highest close: 31226.82, 2026-10-06)
the NQ Probe (Mercury): Close: 30029.75 (+1.18%)
- Vector (CVD): 6,71 K [demand test]
- Range Consumption (ADR Util): 70.98%
the Dyson Sphere (QQQ): Close: 725.21 (+1.06%)
- Population Vector: −129,25 K [supply test]
- Range Consumption (ADR Util): 89.08%
Background Radiation (TICKQ) 191.00 [accumulation]:
- SMA200: -55.48 [market breakdown]
Gravitational Structure (Options):
- Implied Volatility (IV): 21.47%
- Put/Call OI: 1.45
Session data health: readings through 100.0% of the cash session; no gaps longer than one minute; NDX without change longer than 2 min in 0.1% of readings
Logbook: Dysonian Stabilization in the Shadow of a Singularity#
1. Anomalous Accretion and Flow Divergence the NDX Star (29819.60, +1.13%) shows strong negative fuel pressure from CVD at the level of -155,07M, classifying the state as panic. Simultaneously, the NQ Probe (30029.75, +1.18%) moves in demand test mode with CVD amounting to 6,71K. In a historical context, NDX is in a correction phase from the peak of 06.10 (31360.85) amounting to -4.91% (-1541 pts), which, with 11 sessions and an average range of 3.6 ATR, constitutes an event deeper than 57% of recorded corrections. The distance from the resistance node (29940–29960) has increased, while the nearest support node (29640–29660) remains at a distance far from the current position.
2. Background Radiation and Dyson Sphere Stability the Dyson Sphere (QQQ) (725.21, +1.06%) shows a supply test with CVD of -129,25K. Background Radiation (TICKQ) is 191.00, indicating accumulation, even though the average SMA200 radiation at the level of -55.48 signals a market breakdown. The Core composition (>1T) remains stable, without the detection of emergence or the collapse of new singularities. In the Fundamental Fields, events M ≥ 40 were recorded for SPCX (M 64), NFLX (M 56,2) and ISRG (M 45).
3. Mass Dynamics and Invalidation Threshold Total system mass (T-Mass) is 42.57 Trillion USD with IV volatility at the level of 21.47%. A dissonance is observed between the increase in price parameters of instruments and the negative fuel pressure in the center of mass (NDX). The system operates in an area of increased correction relative to the historical median, approaching the support zone from 20.10.
Quantum Verdict: The system is in a state of high flow entropy: rising prices accompanied by simultaneous NDX fuel panic and accumulation in the broad TICKQ radiation suggests a struggle to stabilize the force field within the Dyson Sphere.
Status: EXTERNAL OBSERVATION. Shields active.
End of log.