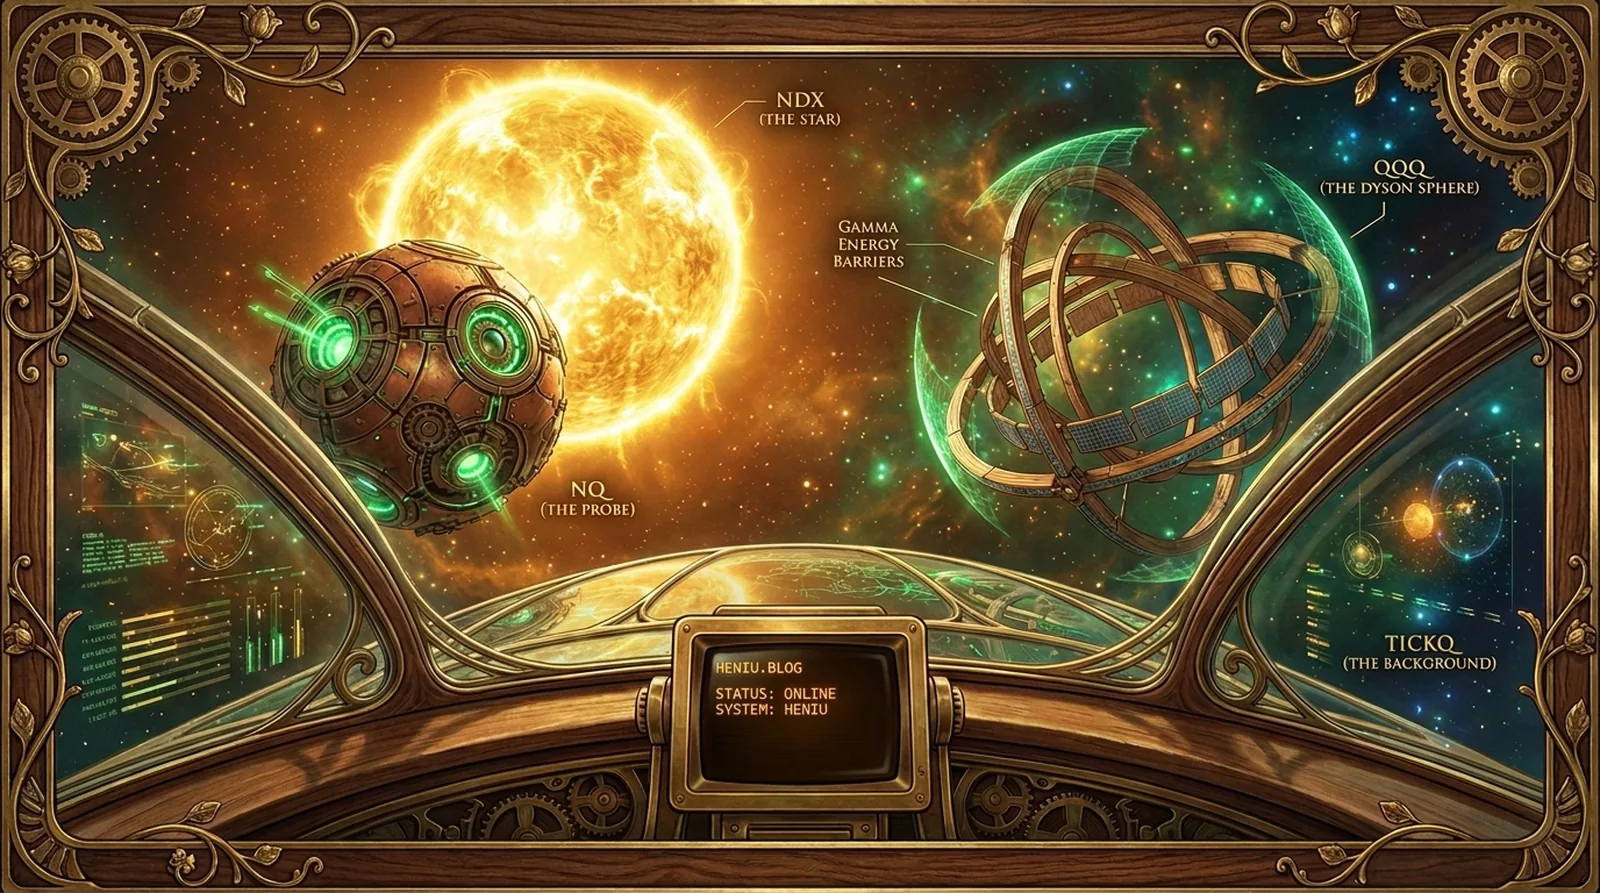

View from Heniu's cockpit: the NDX star, the NQ probe, the QQQ Dyson sphere and the TICKQ background
Live Transmission: Follow Heniu on X for real-time tape observations, pre-market pulses, and cosmic market telemetry!
@heniublog na X →

Posts for: #Weekly-Report

Log #0211: Mass Compression and Volatility Expandability: Week of Negative Accretion

Stardate: 2026.10.25
Systems Status: External Observation
Sector: Inner Volatility Bands


Weekly Telemetry: Opening and Closing Balance

The 2026.10.19 — 2026.10.23 cycle was characterized by a negative T-Mass delta accompanied by euphoria in CVD indicators, signaling a deep dissonant flow structure in the face of declining valuations for NDX, NQ, and QQQ.

  • Subspace Scanner (Weekly Mass Balance):

    • System T-Mass (Open → Close): 41.67 T → 41.20 Trillion USD
    • Weekly Mass Delta: -0.47 Trillion USD (-1.14%)
    • Core Density (Heavy Nine): 66.41% → 66.17% (Delta: -0.24 pp)
    • Average Action (Periphery Temperature): $299.75 → $297.51 (Delta: -$2.24 | -0.75%)
    • Core Composition Fluctuation (>1T): Stability (no emergence/collapse)
  • the NDX Star (Sun — 5 Session Balance):

[]

Log #0205: Gravitational Collapse and Decay of Orbital Structures

⚠️ ERRATUM (2026-10-18)
The weekly balance had three errors: the IV change, the NQ range and the price label.

Corrections:

  • Implied volatility (IV) rose by 4.04 p.p. since Monday (from 18.72% to 22.76%), not relative to the weekly average. The weekly average was 19.61%, i.e. 3.15 p.p. below Friday’s reading.
  • NQ weekly range: 29353.00 — 31242.00 (amplitude 1889.00 pts), not 29379.75 — 31242.00 (1862.25 pts). The range was taken from prices quoted in the T-Logs and did not include the Friday close (29353.00), which was below the stated low.
  • The value labelled “Monday Open” is the previous Friday’s close, from which the weekly changes are calculated, not Monday’s opening price. We corrected the label; the weekly changes stay the same.

Stardate: 2026.10.18
Systems Status: External Observation
Sector: Inner Volatility Bands

[]

Log #0199: Aggregation Paradox: Mass Expansion with Negative Energy Flow (CVD)

⚠️ ERRATUM (2026-10-18)
The price label in the weekly balance was wrong.

Corrections:

  • The value labelled “Monday Open” is the previous Friday’s close, from which the weekly changes are calculated, not Monday’s opening price. We corrected the label; the weekly changes stay the same.

⚠️ ERRATUM (2026-10-17)
The weekly CVD flow for NQ futures was wrong. The report showed the NDX index value instead of NQ futures.

Corrections:

  • NQ weekly CVD: −14.07 K [sell-off], the sum of five daily closes (+44.75 K, −11.08 K, +3.90 K, −41.22 K, −10.42 K), not −115.87 M [panic]. The −115.87 M value came from the NDX index.
  • Average Action: the correct values cannot be reconstructed, so we removed them.

Stardate: 2026.10.11 System Status: External Observation Sector: Inner Volatility Bands

[]

Log #0181: Warp Expansion and Mass Accretion in the Shadow of a Sell-off

⚠️ ERRATUM (2026-10-18)
The price label in the weekly balance was wrong.

Corrections:

  • The value labelled “Monday Open” is the previous Friday’s close, from which the weekly changes are calculated, not Monday’s opening price. We corrected the label; the weekly changes stay the same.

Stardate: 2026.09.20 Systems Status: External Observation Sector: Inner Volatility Bands


Weekly Telemetry: Opening and Closing Balance

The weekly cycle was characterized by an expanding trajectory of the NQ Probe accompanied by an increase in the total mass of the system (T-Mass), despite strong sell-off radiation of the TICKQ indicator.

[]

Log #0171: Accretion in the Shadow of the Core: Trajectory Stabilization in a Low Entropy Regime

⚠️ ERRATUM (2026-10-18)
The price label and the weekly ranges in the balance were wrong.

Corrections:

  • The value labelled “Monday Open” is the previous Friday’s close, from which the weekly changes are calculated, not Monday’s opening price. We corrected the label; the weekly changes stay the same.
  • NDX weekly range: 29029.46 — 29542.65 (amplitude 513.19 pts), not 29029.46 — 29527.55 (498.09 pts). QQQ range: 706.72 — 719.06 (12.34 USD), not 706.72 — 718.69 (11.97 USD). The ranges were taken from prices quoted in the T-Logs and did not include the Friday close, which was above the stated high.

Stardate: 2026.09.06 Systems Status: External Observation Sector: Inner Volatility Bands

[]

Log #0165: Mass Expansion and Core Orbit Stabilization

⚠️ ERRATUM (2026-10-18)
The price label in the weekly balance was wrong.

Corrections:

  • The value labelled “Monday Open” is the previous Friday’s close, from which the weekly changes are calculated, not Monday’s opening price. We corrected the label; the weekly changes stay the same.

Stardate: 2026.08.30 Systems Status: External Observation Sector: Inner Volatility Bands


Weekly Telemetry: Opening and Closing Balance

The weekly cycle was characterized by an increase in the total mass of the system (T-Mass) and a strengthening of the core density, while simultaneously compressing implied volatility. A transition from a high fluctuation phase to structured accretion is observed.

[]

Log #0159: Accretion in the Shadow of a Sell-off

Stardate: 2026.08.23 System Status: External Observation Sector: Inner Volatility Bands


Weekly Close Telemetry

The system is in a state of paradoxical price expansion with a simultaneous fuel deficit in the center of mass. High TICKQ radiation suggests a rapid energy flow that is not fully reflected in the Mother Star’s CVD structure.

  • Subspace Scanner (Mass Distribution):

    • System T-Mass: 41.17 Trillion USD
    • Weekly Delta: -0.02 Trillion USD
    • Core Density (Heavy Nine): 67.53% (Delta: -0.01%)
    • Average Action (Periphery Temperature): $311.08 (Delta: +$31.34)
  • the NDX Star (Sun): Close: 29311.40 (+0.33%)

[]